This manual describes the use of the transfer model to estimate the cadmium concentration in pig kidney and liver based on oral exposure to feed contaminated with cadmium. The model has several input fields (left side) and output fields (right side). The input and results can be saved using the button “Report (*.docx)”. Source information and a citation suggestion are provided (top).
Step1: Contamination level of feed
The user can provide the contamination level in feed (expressed in mg cadmium/kg 88% dry matter) in the contamination field. Only for wet mixes, the contamination level is expressed in 25% dry matter per day. For the background level of cadmium in feed a default value is provided. The user can adjust this default value.
Step 2: Feed intake
The user first has to select the type of feed that is contaminated with cadmium.
a) This can either be:
• Total compound feed (blend of various raw materials and additives)
• Wet mixes (mixture of compound feed, solid and liquid by-products and water)
• Compound feed ingredients
• Other feed regime (to use a specific feed regime instead of the default regime – see step 2b)
When compound feed ingredients are selected, a drop down menu will appear to select the contaminated compound feed ingredient. Also, a field will appear with a default percentage of the compound feed ingredient in the total compound feed. The user can adjust this default value.
b) After selecting the contaminated feed (ingredient), the default time-dependent intake1 (in kg 88% dry matter per day) starting at day 28 (compound feed; in kg 88% dry matter per day) or at day 66 (wet mixes; in 25% dry matter per day) will be depicted in the graph (blue line). This line will be visible after the ‘Run model’ button, present at the bottom of the input fields, is pressed.
The user can use a specific feeding regime instead of the default regime by choosing ‘Other feed regime’ in step 2a. The user can adjust the feed intake (in kg 88% dry matter per day) for five age categories of the pig (day 0-28, day 29-75, day 76-125, day 126-175, day >175). The (adjusted) feed intake regime will be depicted in the graph (blue line) after the “Run model” button is used.
Step 3: Exposure period of pig to contaminated feed
To estimate the concentration of cadmium in the pig kidney and liver, the user has to enter the age of the pig at the beginning of the exposure period, the duration of the exposure to the contaminated feed (ingredient) and the time period after the exposure stopped (all expressed in days).
Step 4: Regulatory limit (optional)
Regulatory limits (for instance maximum levels) (expressed in mg cadmium/kg tissue) can be inserted for liver and/or kidney.
Step 5: Running model
The “Run model” button, present at the bottom of the input fields, can be used to run the model. After changing any value in the input fields, the “Run model” button has to be used to update the results.
Step 6 Results
After running the model the results will appear in the output field. The user can select “Plot liver” and/or “Plot kidney” and/or the feed intake curve. The graph displays the cadmium concentration in liver (in mg cadmium/kg liver, black solid line) and/or in kidney (in mg cadmium/kg kidney, black dashed line) and/or the feed intake (in kg dry matter/day, blue line, scale depicted on right axis) versus time.
Several tools for viewing the graphs become visible on the right top of the graphs upon hoovering. The option ‘show closest data on hoover’ will the display the exact x and y-values when hoovering the plotted result. The tool ‘compare data on hoover’ shows the cadmium concentrations and/or the feed intake for all plots simultaneously.
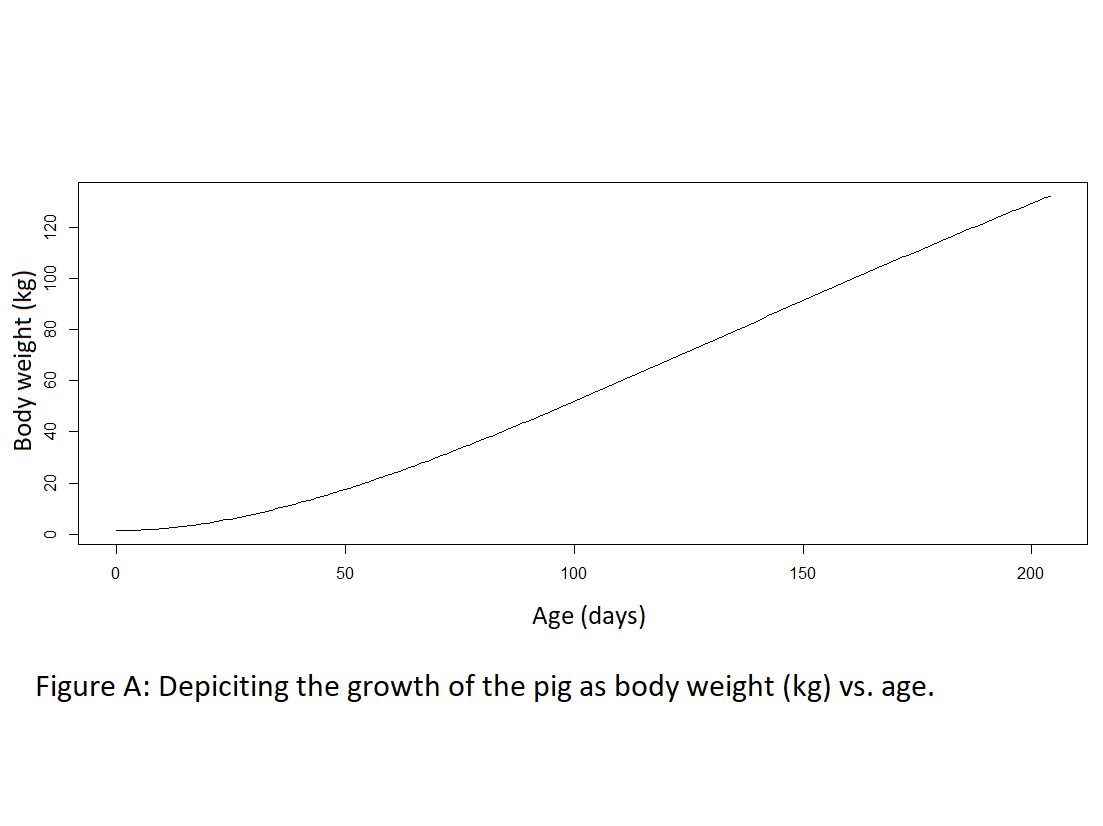
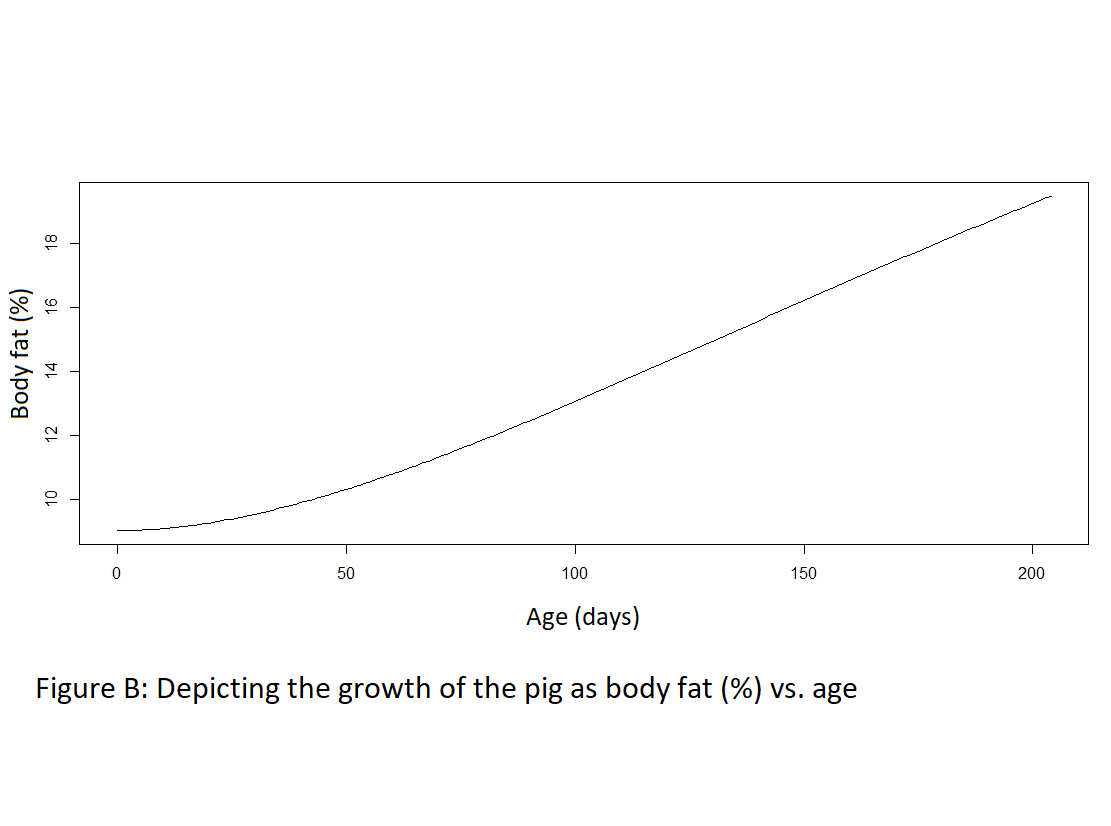
The growth of the pig has been taken into consideration in the model and default feed regimes, based on the data depicted in Figures a and b below. These figures show the body weight and percentage body fat versus the time. The total TEQ concentrations, body weights and fat percentages are valid for the average pig2.
Step 7: Saving input and output
Using the “Report (*.docx)” button, present at the bottom of the input fields, input data and the results of the model run can be stored locally as a report file in word. Input data and results are not stored at the website.
Step 8: Citation suggestions
At the top of the model page, the reference that describes the model is listed, as well as a citation suggestion. Please use the suggested citation, when referring to the model.
1 WFSR feed database(opens in a new window).
2 Van Raamsdonk LWD, Kan CA, Meijer GAL, Kemme PA (2007) Key figures for some farm animals and their consumption patterns [in Dutch]; https://research.wur.nl/en/publications/kengetallen-van-enkele-landbouwhuisdieren-en-hun-consumptiepatron.